I strive to follow the style of Edward Tufte. There were designed for introducing a concept at professional presentations and lectures. The figures are under the Creative Common license. However, I would be glad if you credit me when you are using one of the figures in a presentation or in a publication.
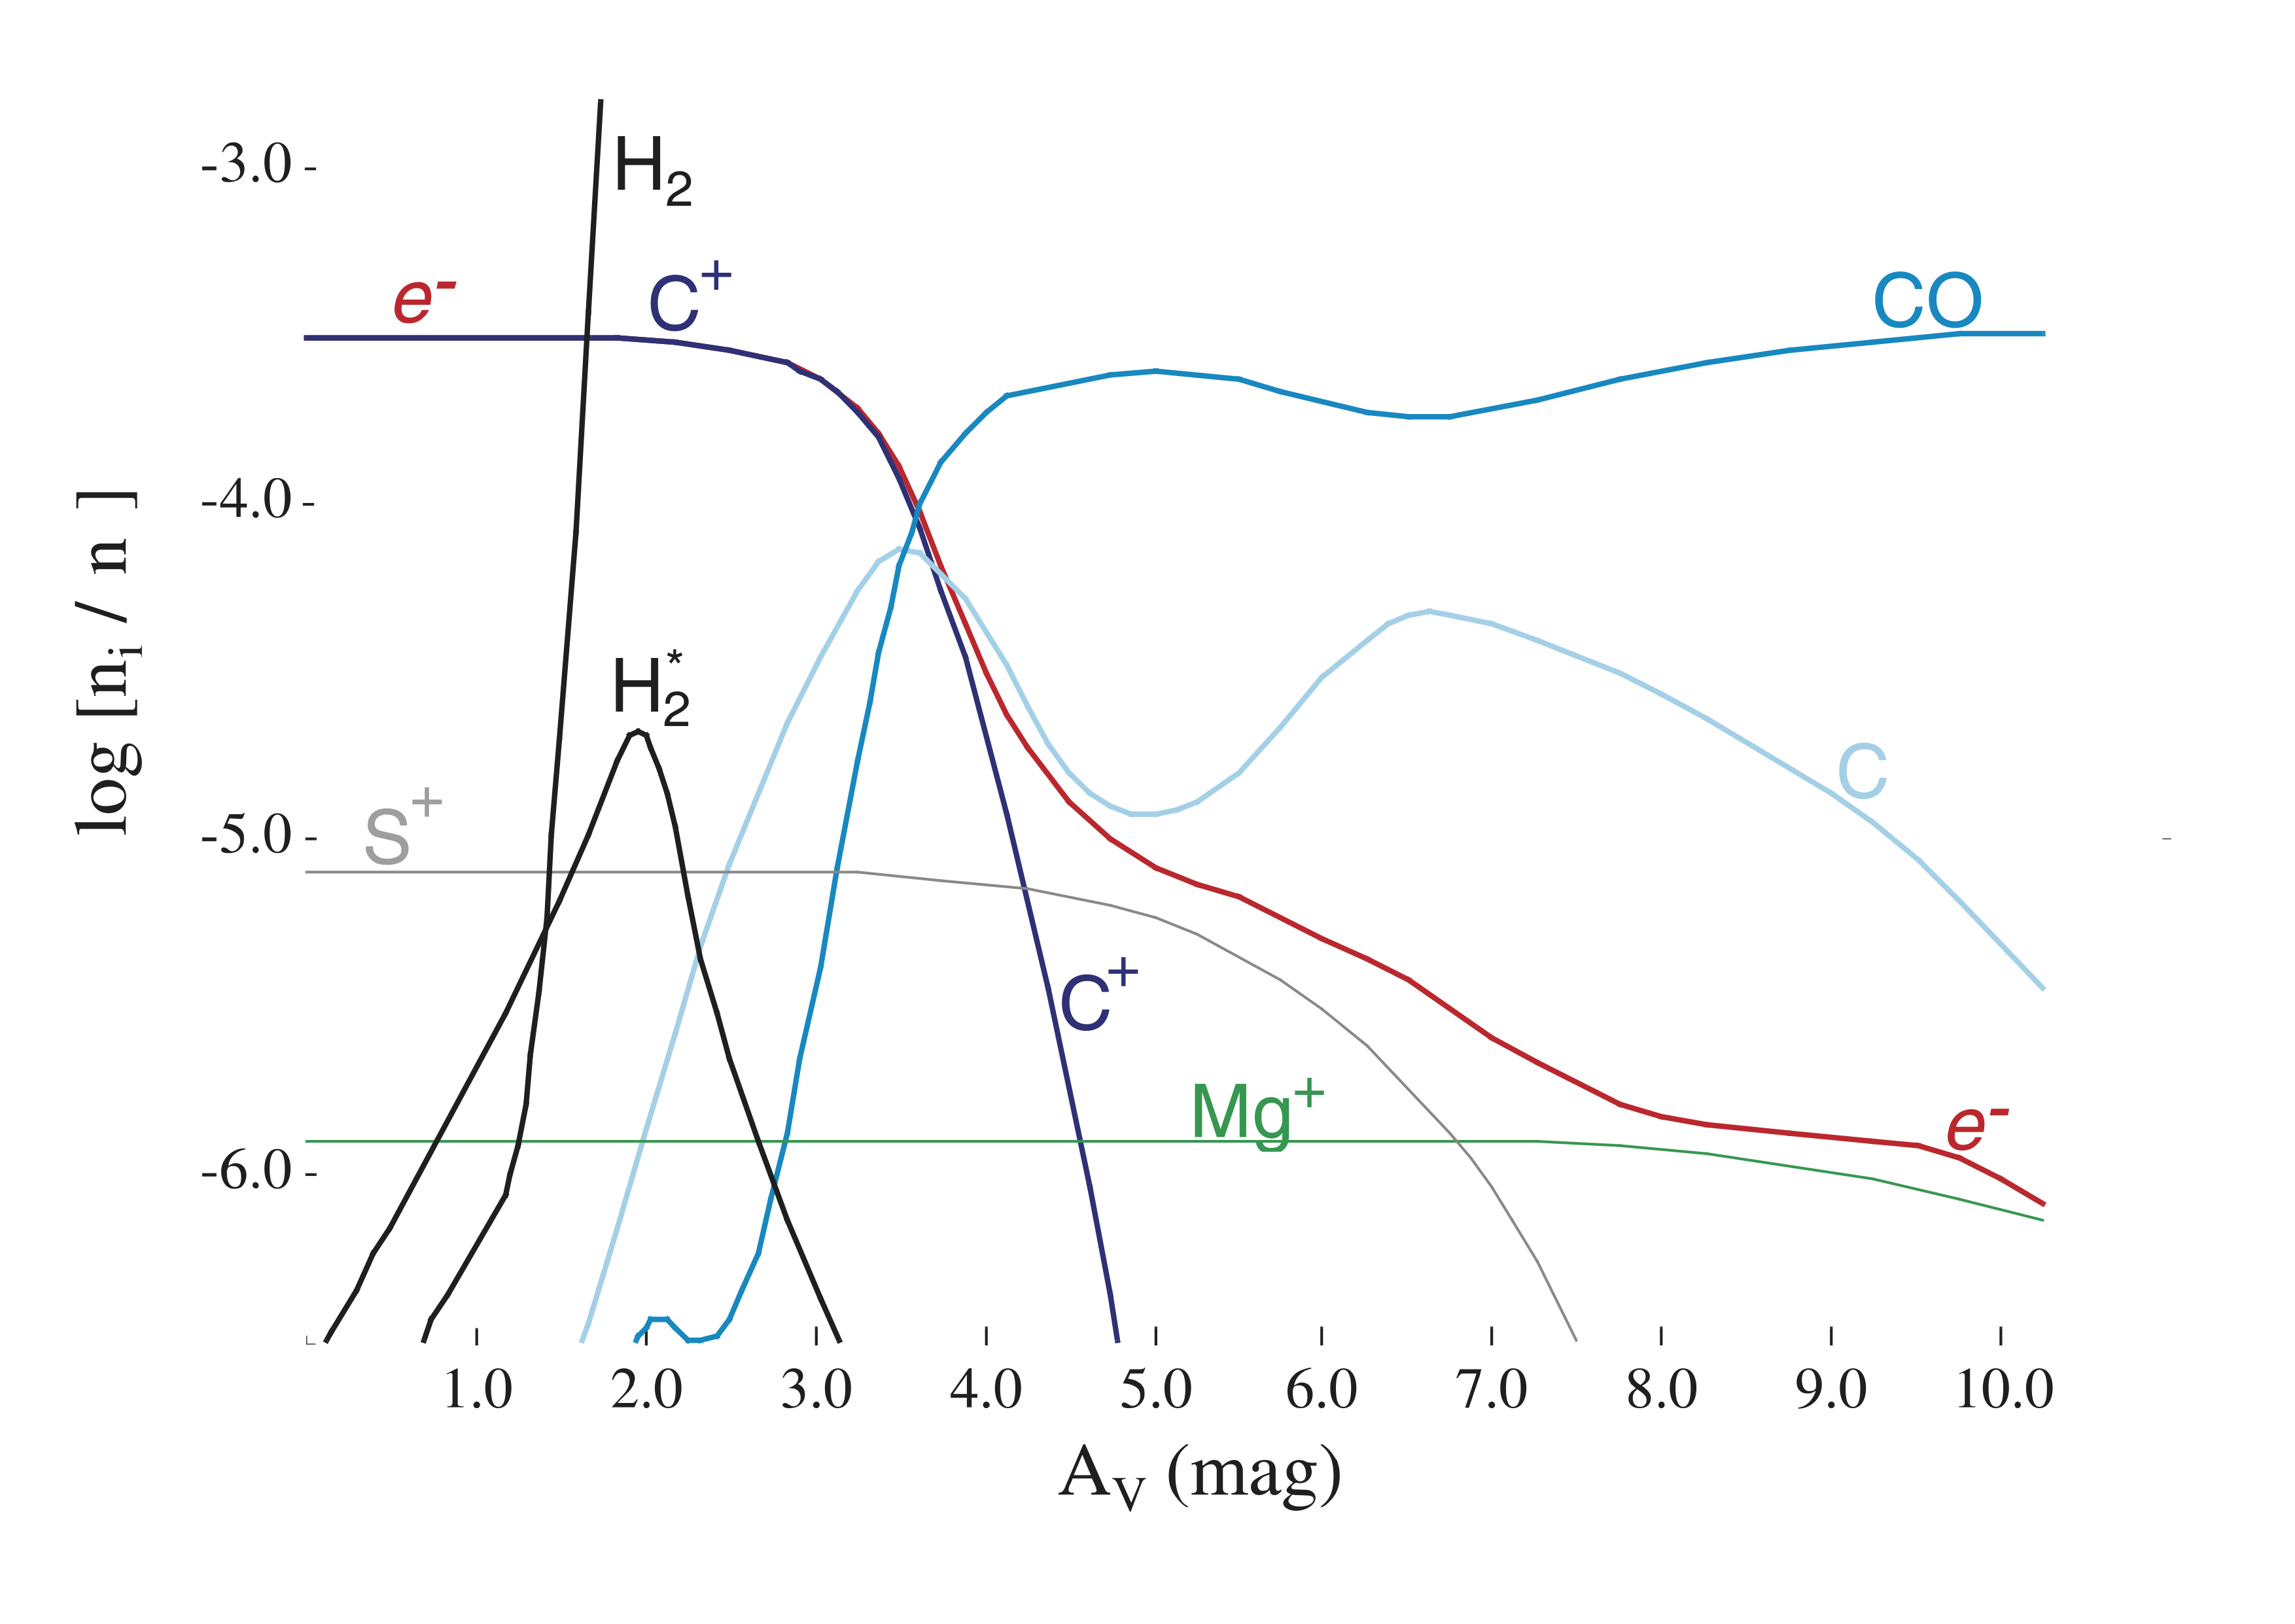
Photodissociation region
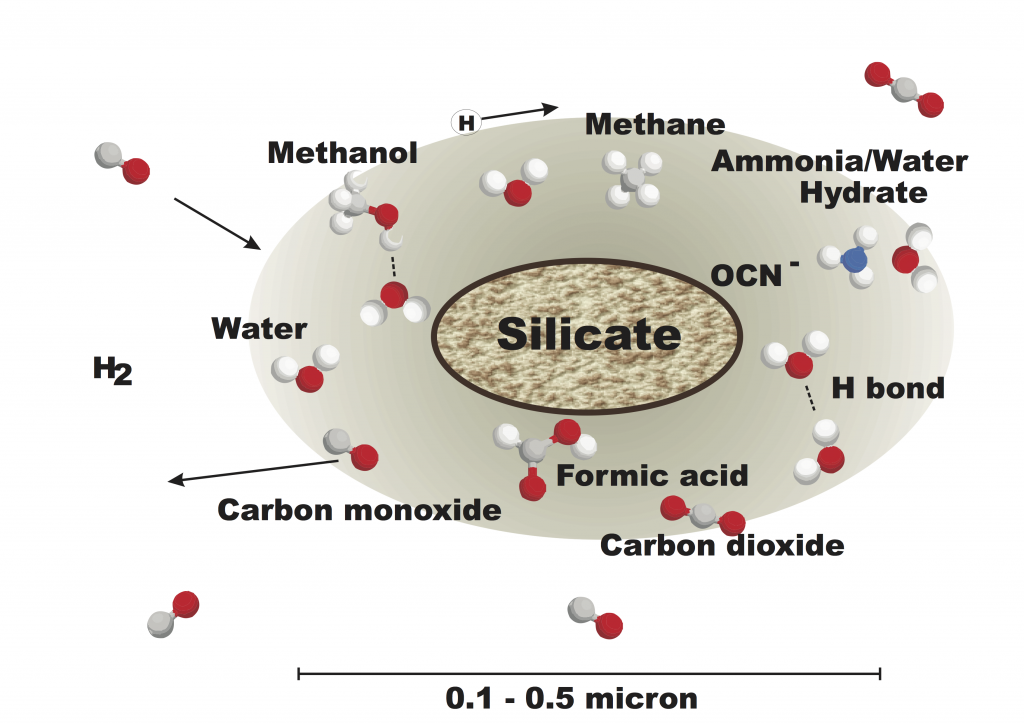
Dust grain model
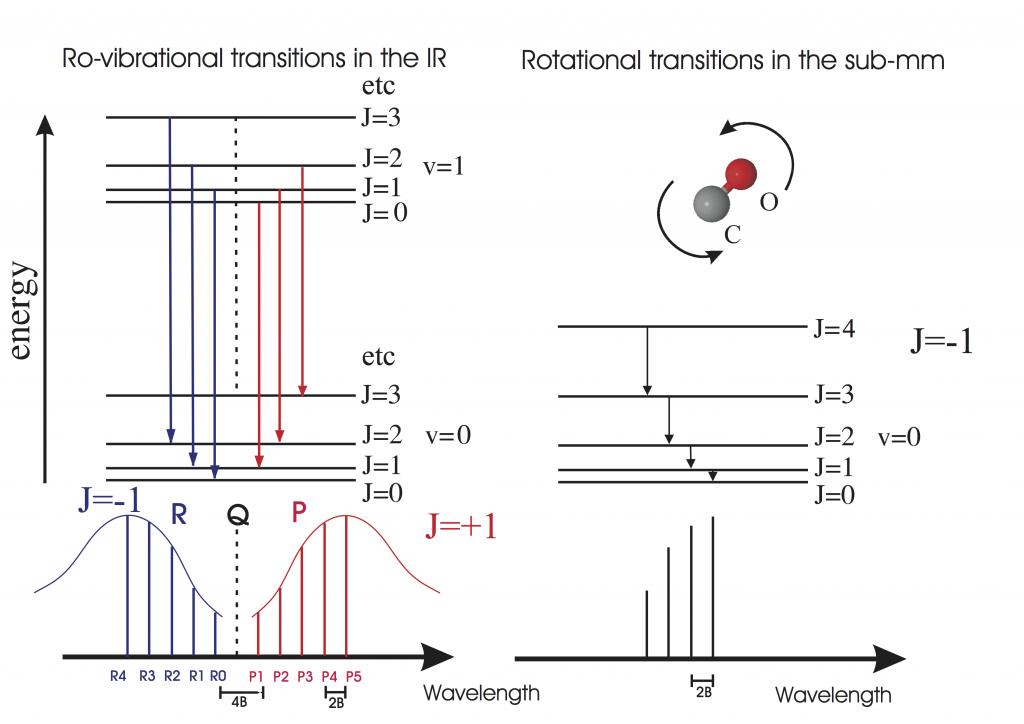
CO ro-vibrational transitions
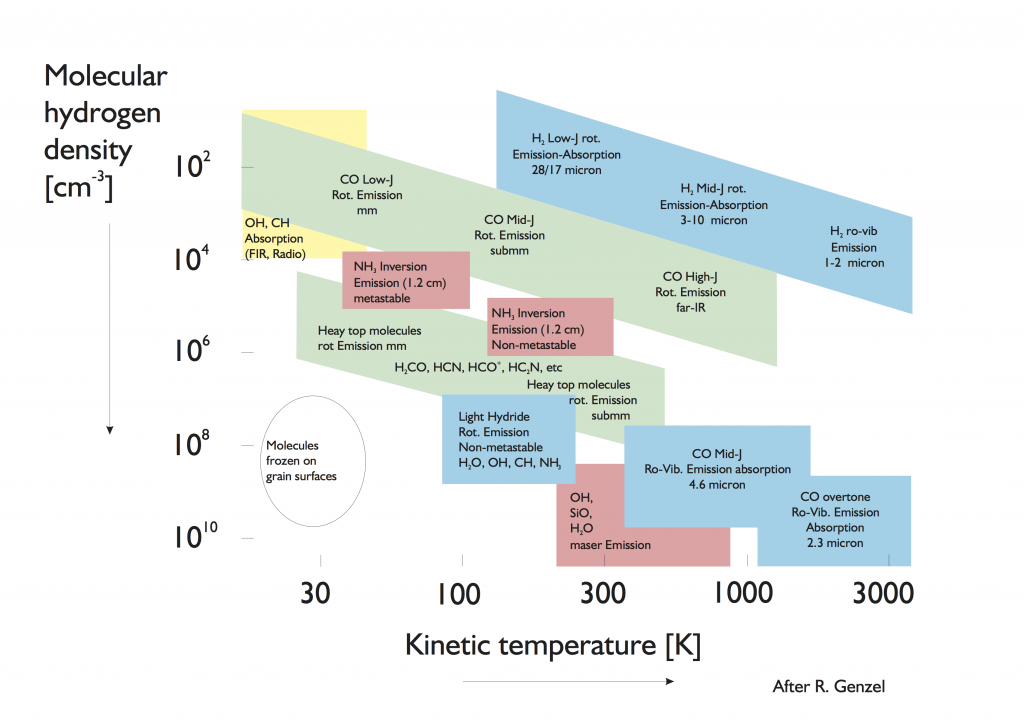
Gas characteristic tracers
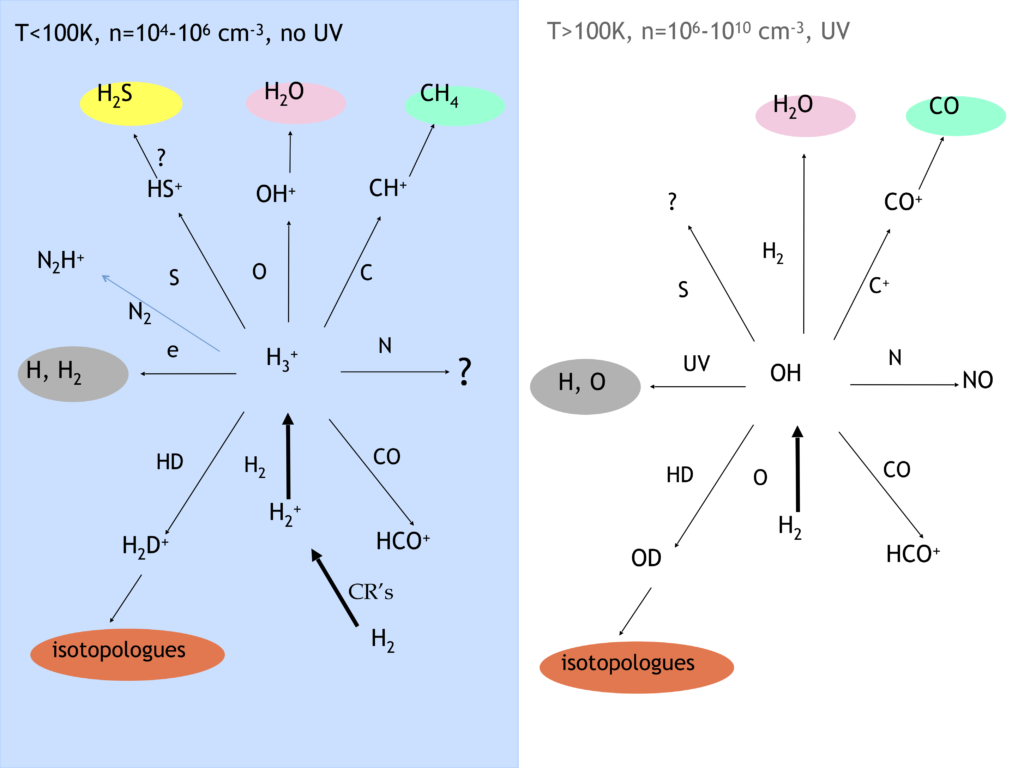
Cold and warm gas interstellar chemistry network
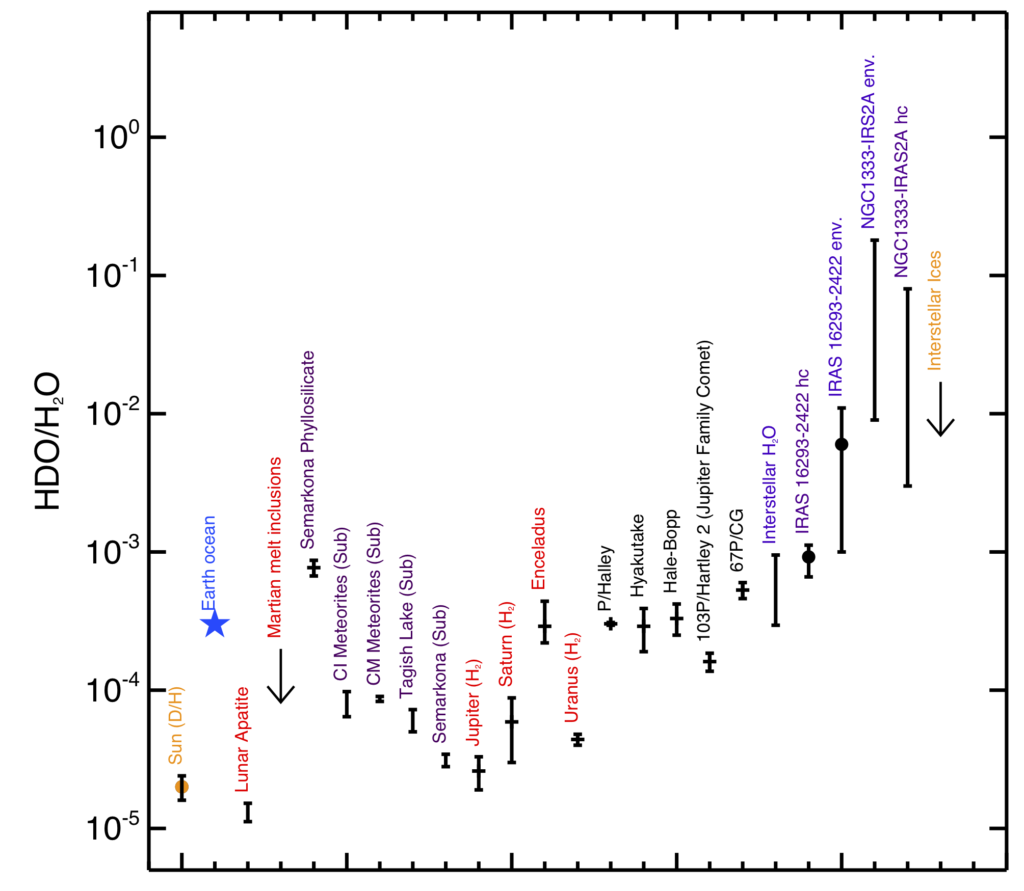
HDO/H2O ratio
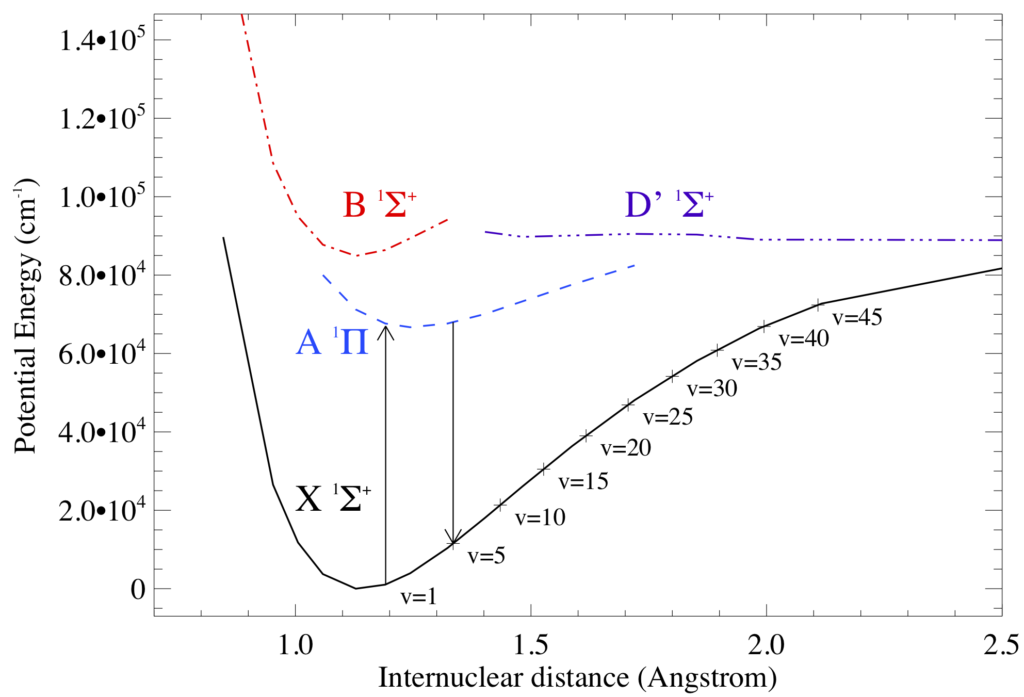
CO potential energy curve
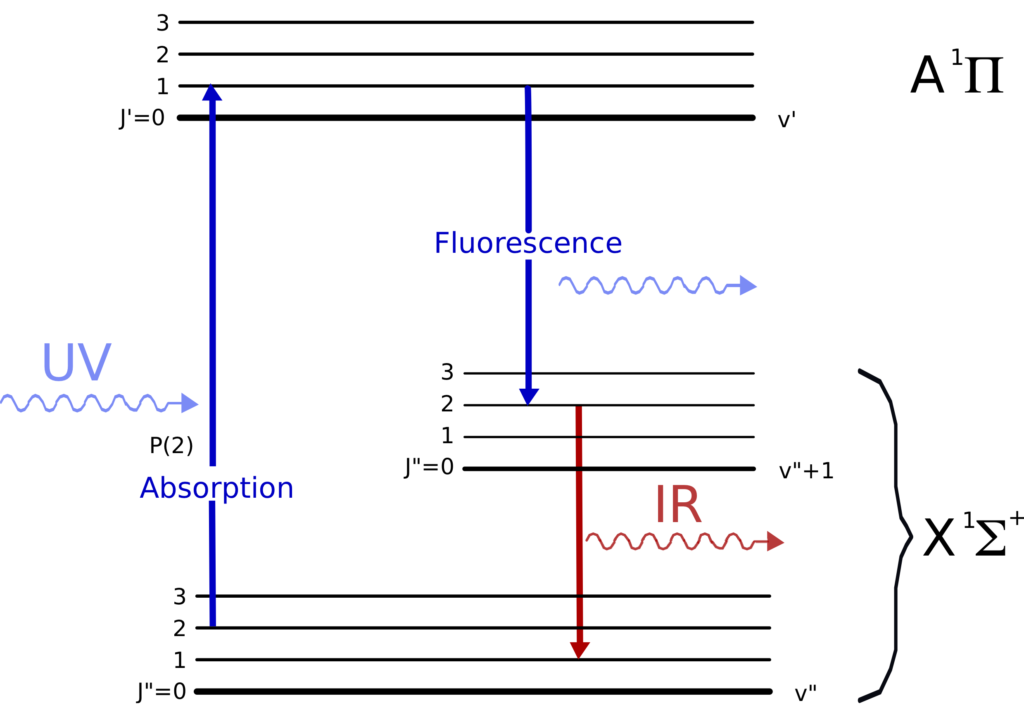
CO level population fluorescence punmping
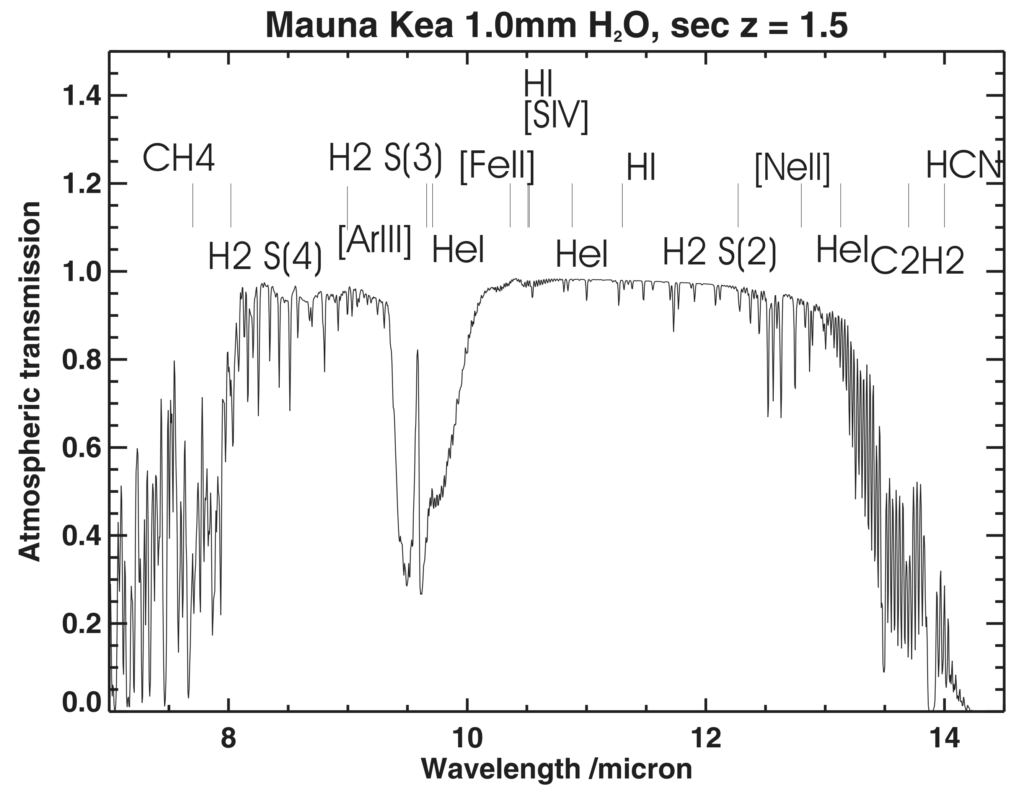
Atmospheric transmission in the IR above Mauna Kea
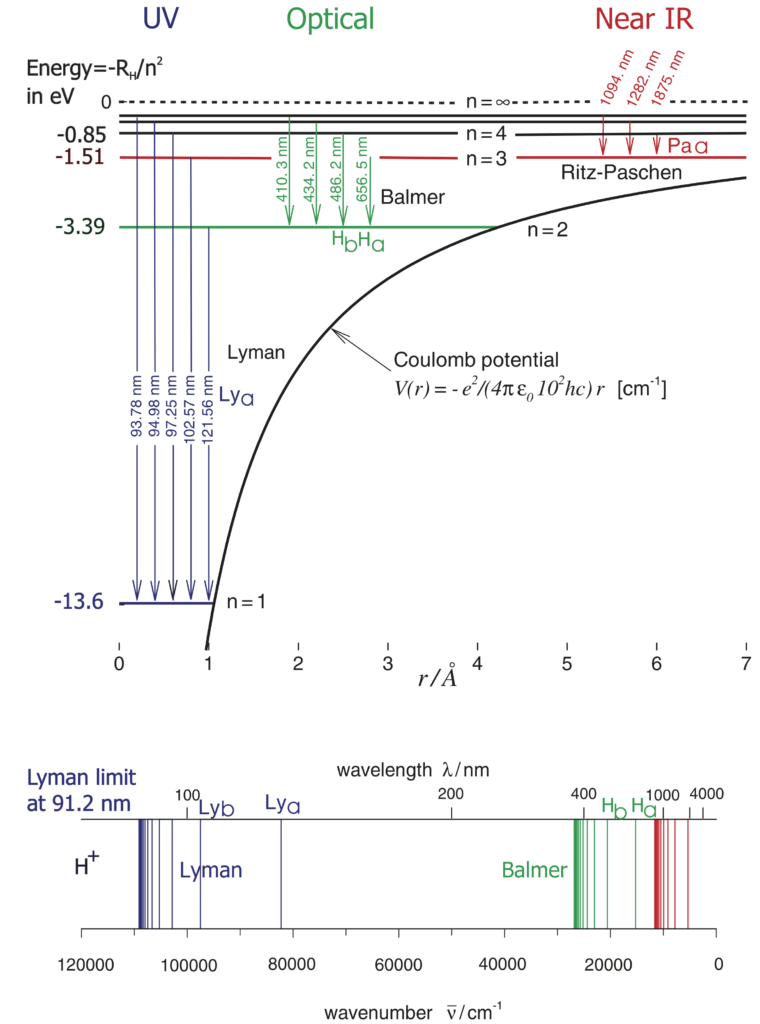
Hydrogen atom levels
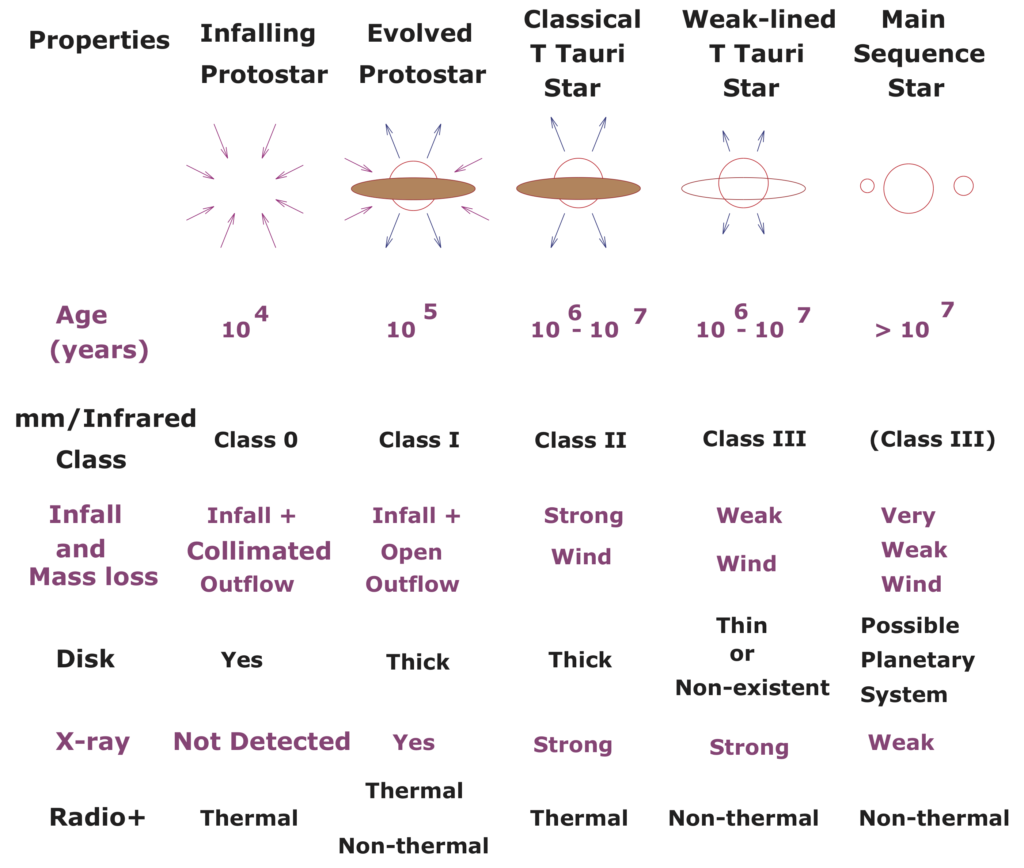
Young stellar object properties
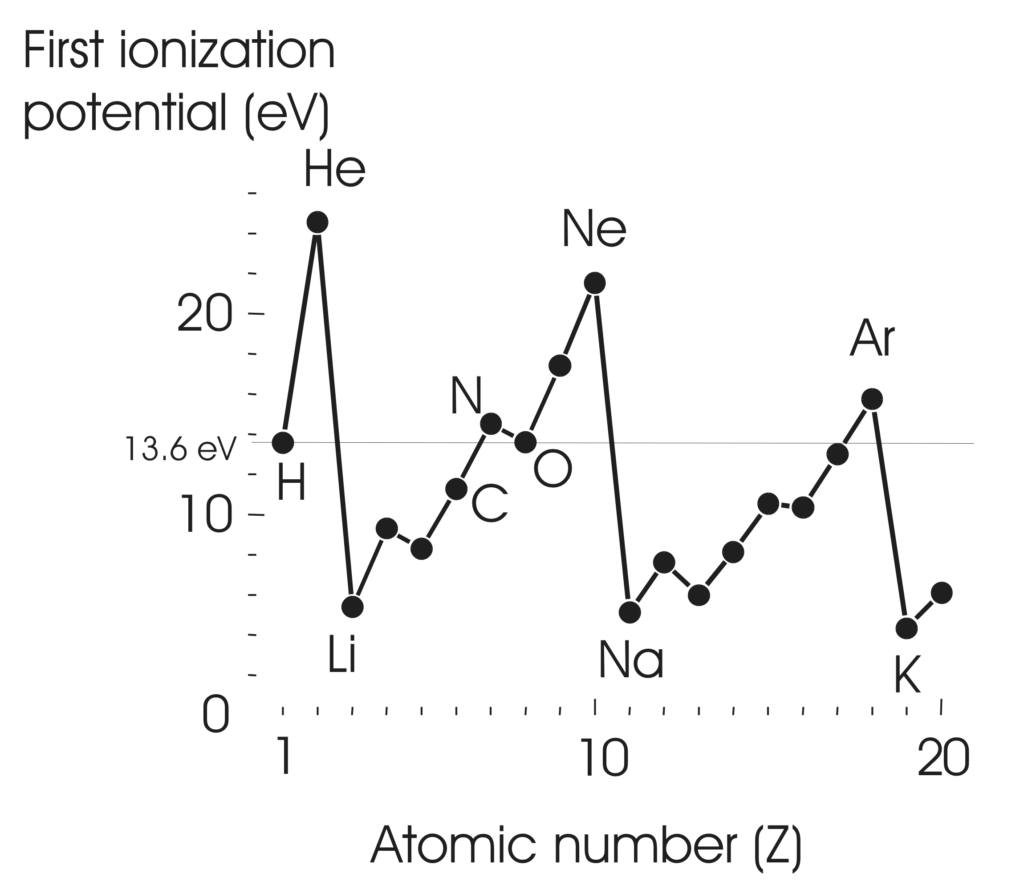
Ionization Potential
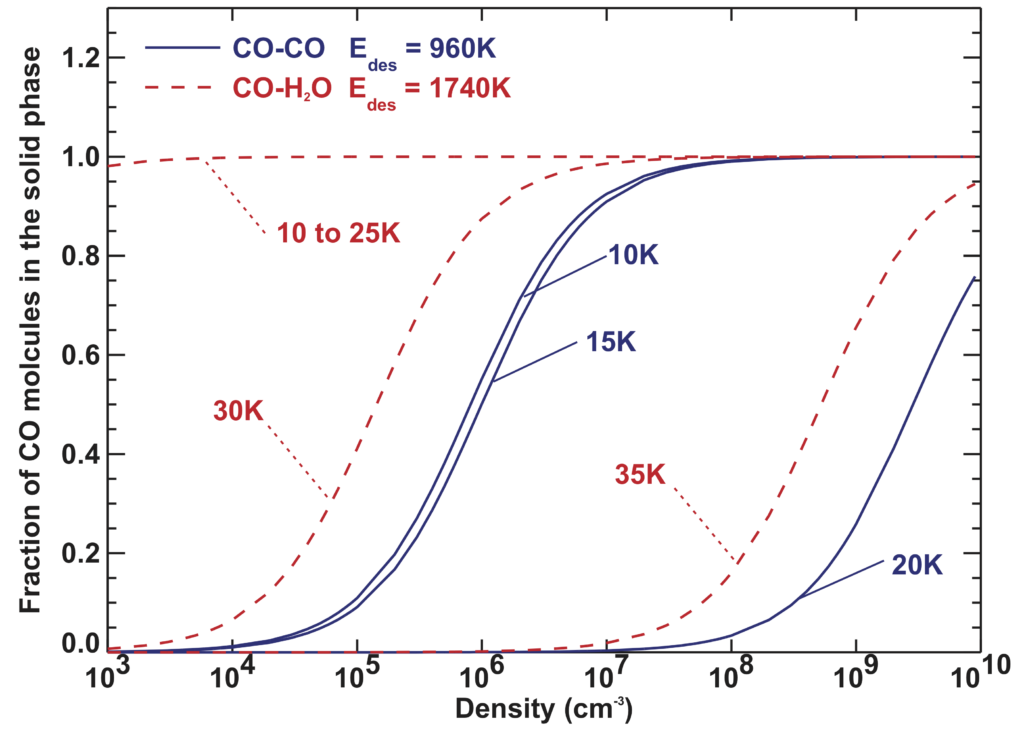
CO freeze-out
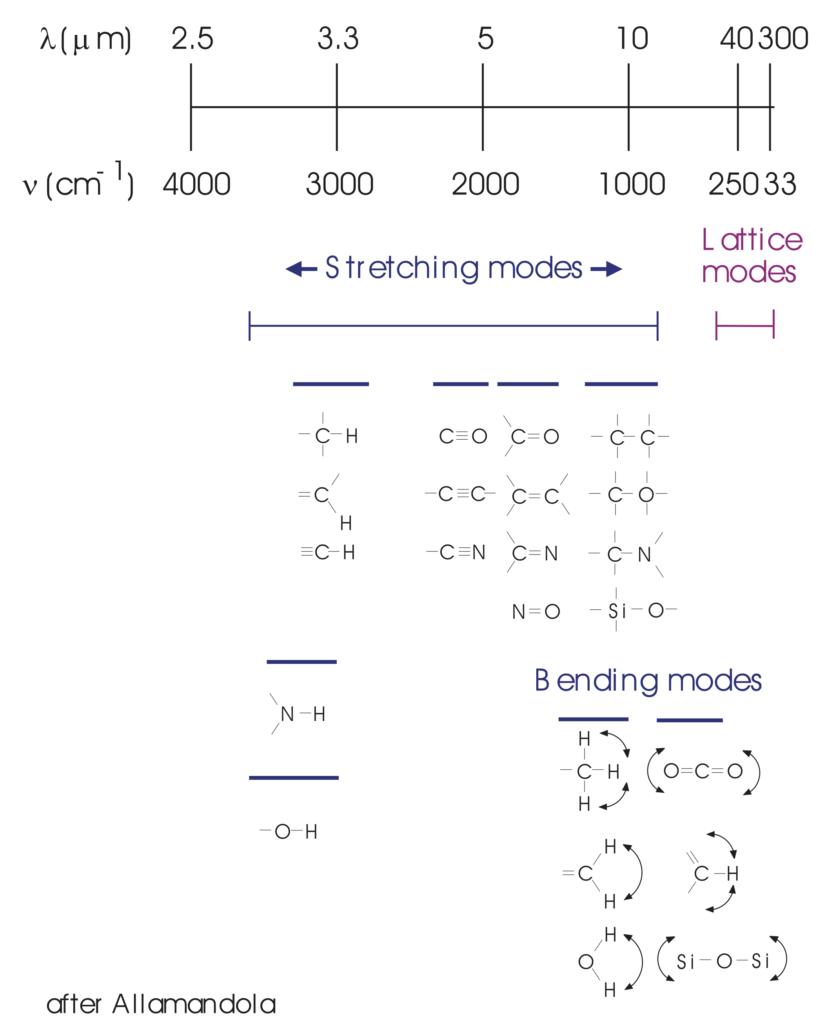
IR feature assignments of the vibration modes of solids
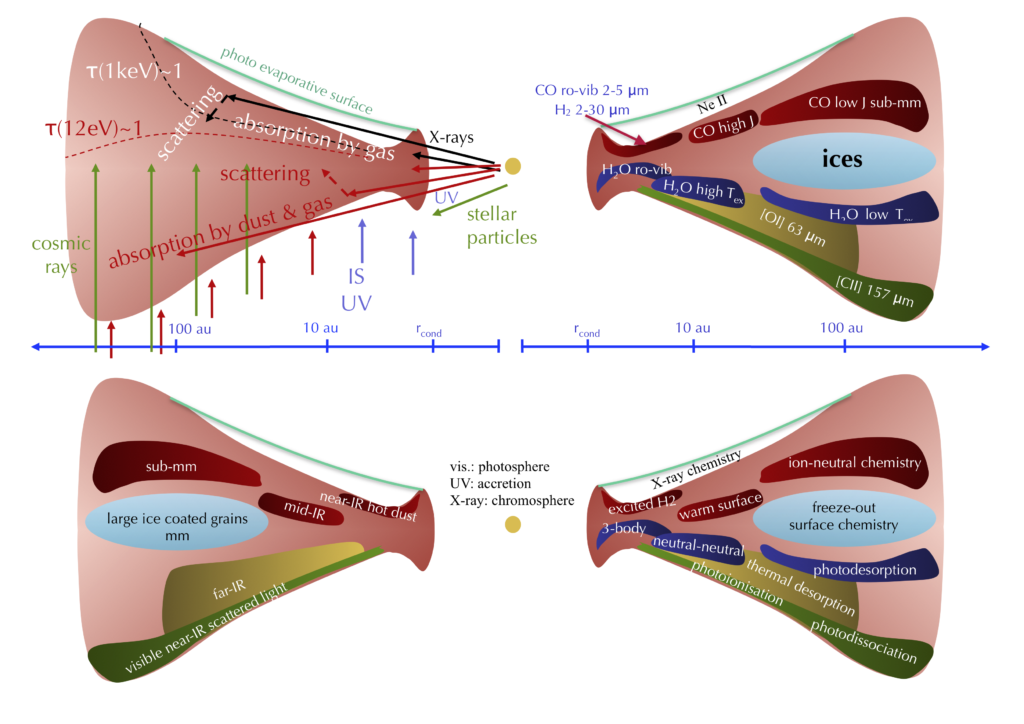
Processes in protoplanetary disks
(credit Inga Kamp & Wing-Fai Thi)
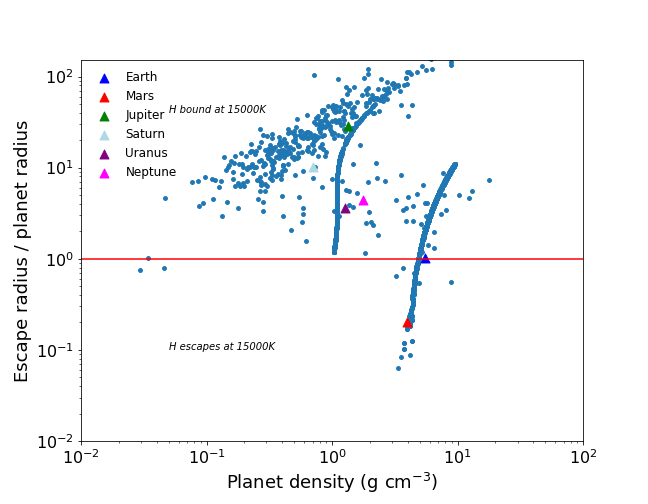
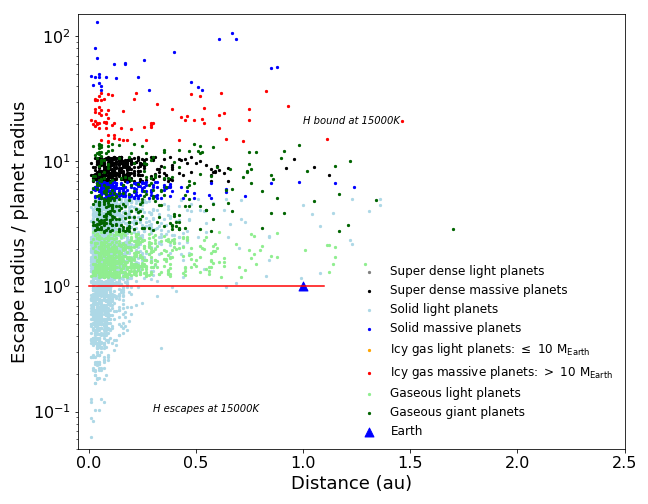
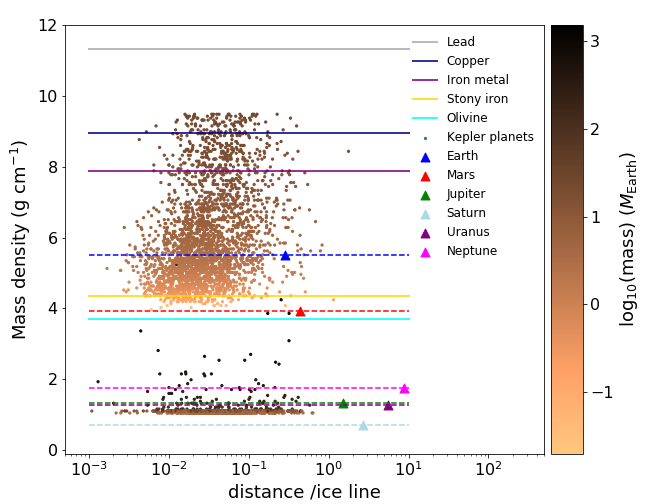
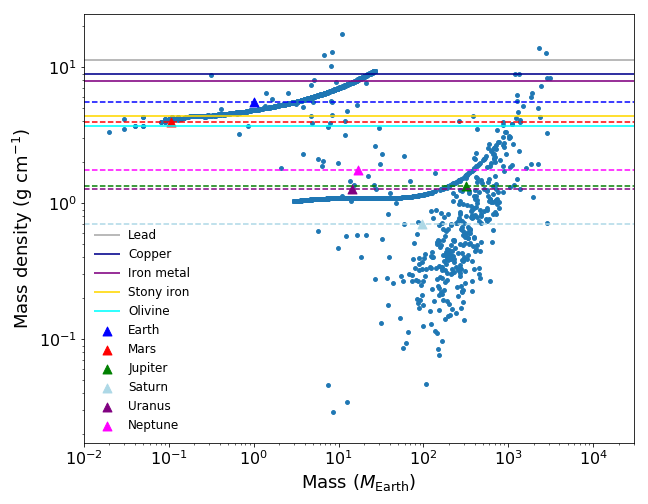
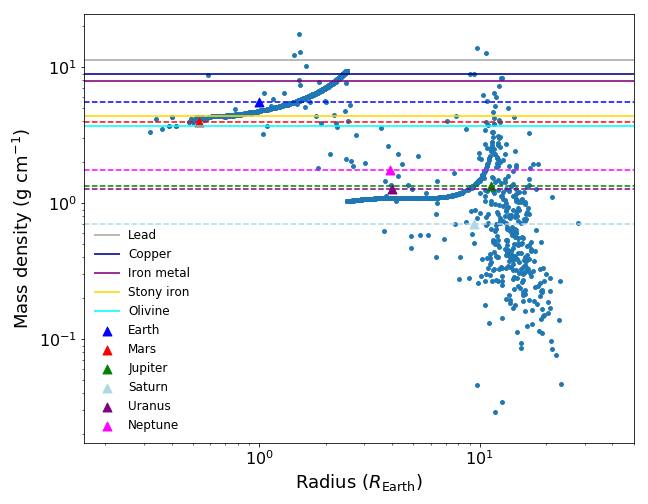
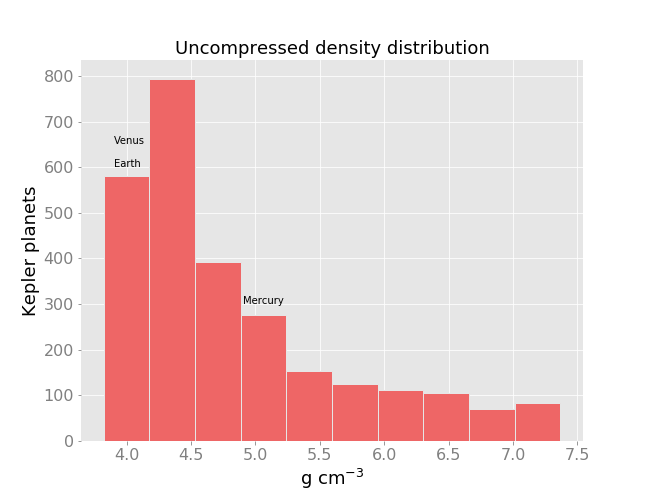
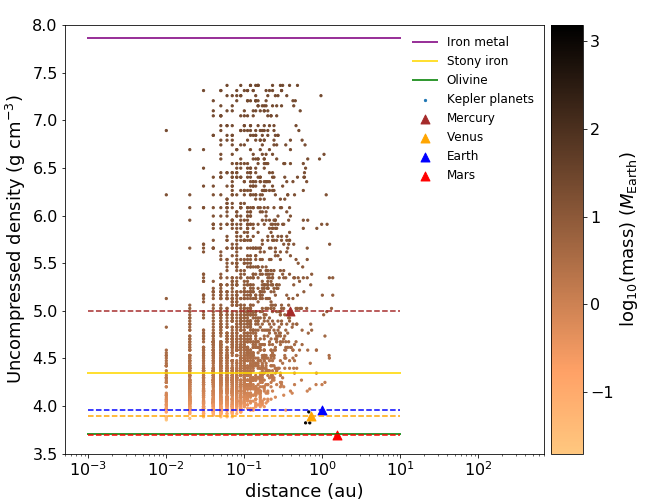
Exoplanet statistics
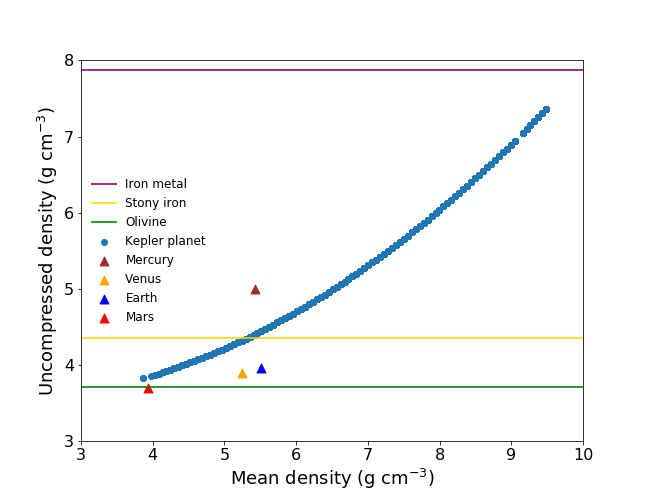
Plots made using exoplanet using data from University of Puerto Rico Planetary Habitability site (it includes unconfirmed Kepler candidate exoplanets) and the Extrasolar Encyclopedia site (downloads on 10/3/2018). In one of the plots, one can see that the planet mean density exceeds the mass density of
metallic iron. Therefore these densities should be considered with caution.
The plots are made for education purpose. The IPython notebook used to created the figures is provided so that you can re-create new ones when more planets are found.
Exoplanet plots using the uncompressed densities
(see notebook for more information about the difference between planet density and planet uncompressed density)
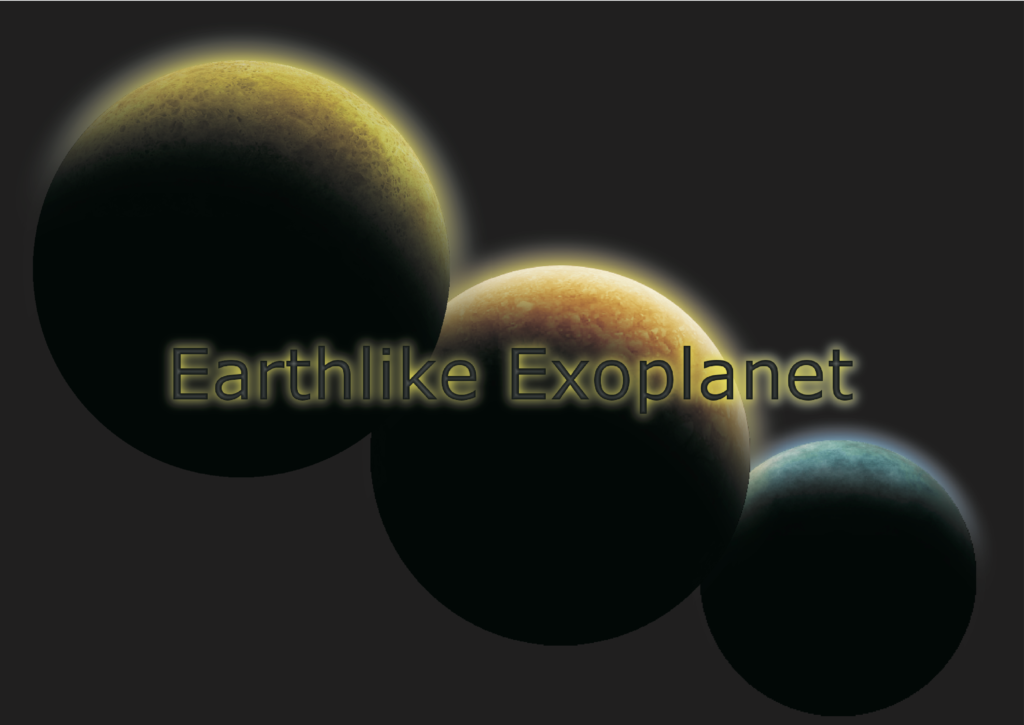
Exoplanet artist’s impression
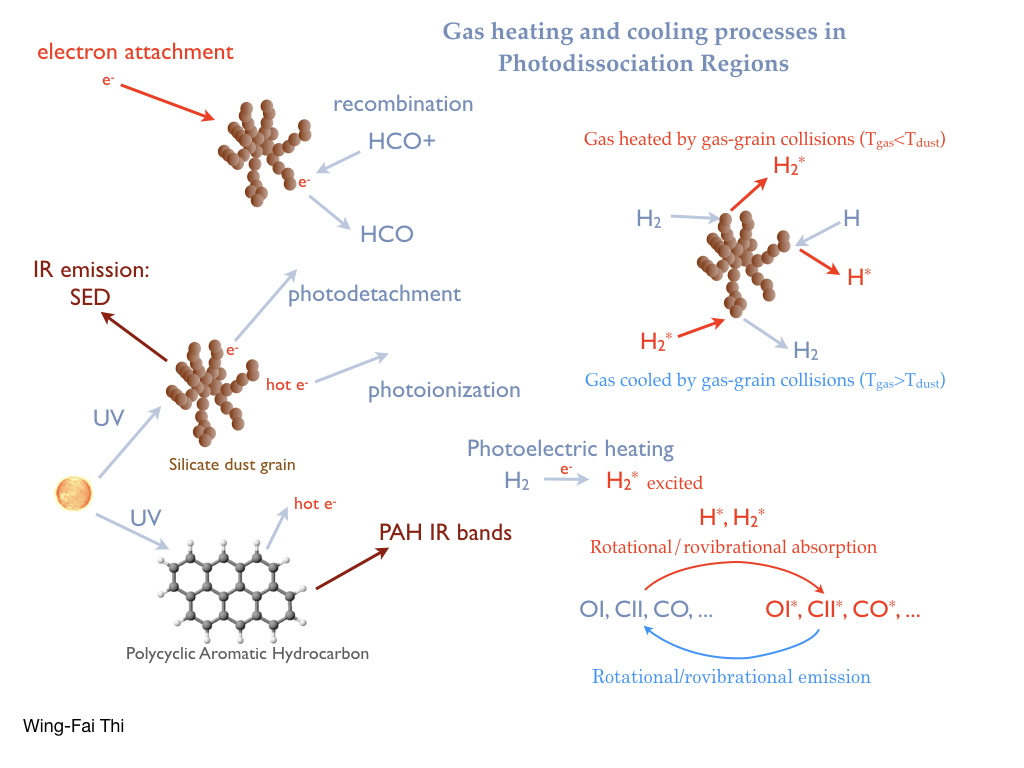
Dense interstellar gas heating and cooling processes
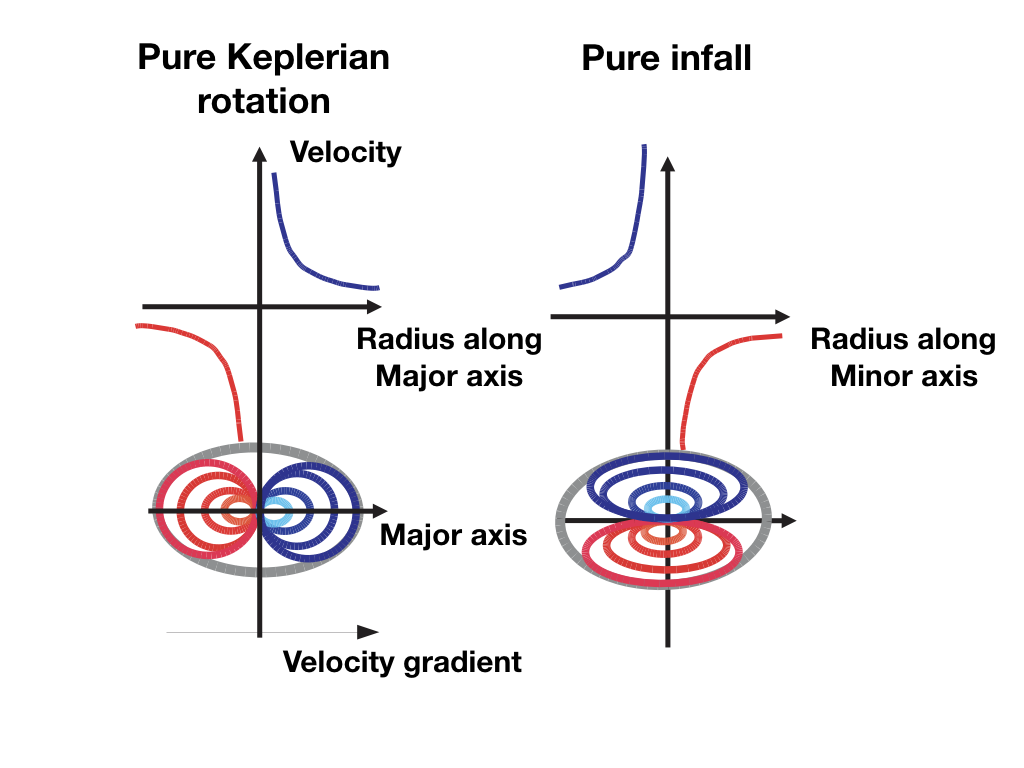
Keplerian rotation versus Infall velocity
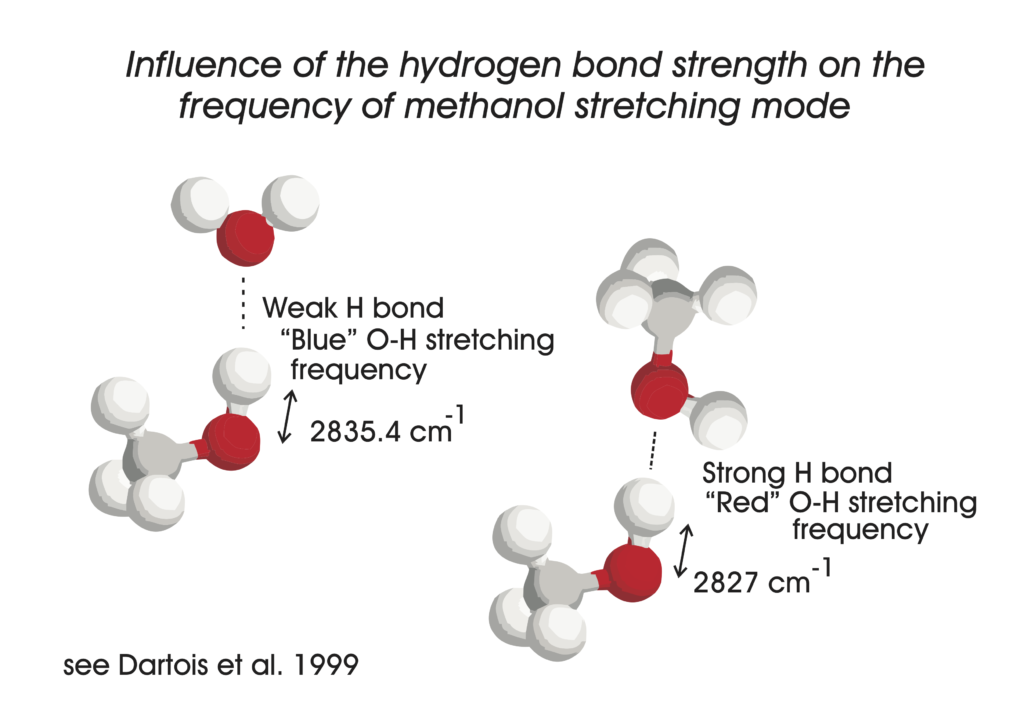
Methanol-water ice complex
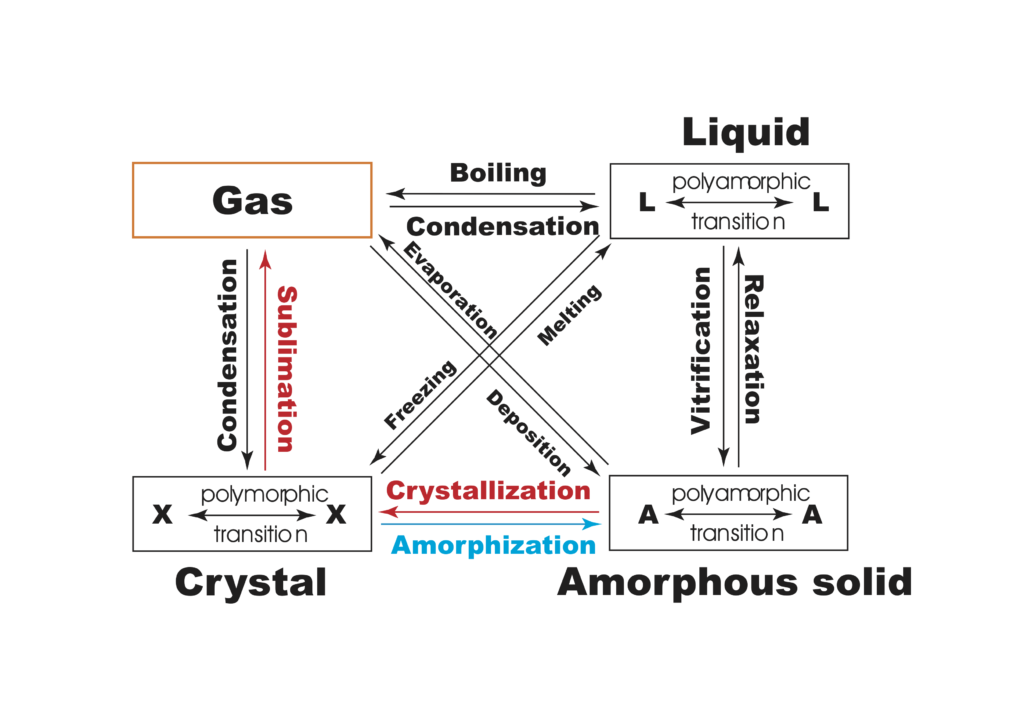
Some vocabulary
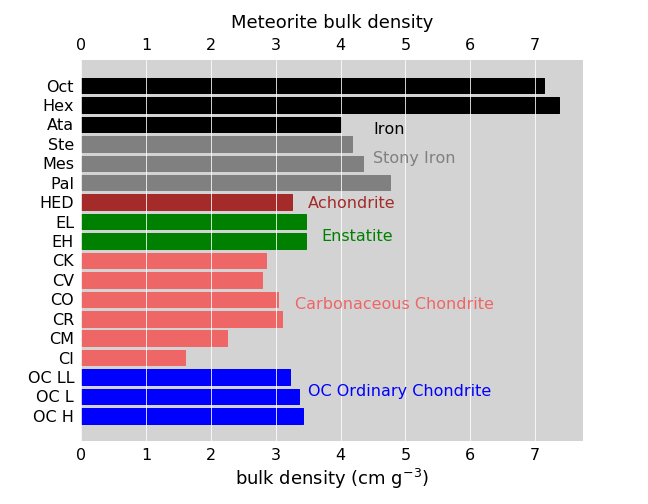
Meteorite density
(data taken from a values gathered by B. Carret, see the exoplanet notebook for more information)

